
Call Our Support
+91-9810811460
S 139, Arjun Marg Mall,
DLF Phase 1, Gurgaon 122002
Write Us
contactwelpro@gmail.com
The stock market never stays still. Market indexes see gains and losses every day—in more settled periods, the S&P 500 gains or loses less than 1% a day. But from time to time, the market experiences dramatic price changes, a phenomenon that’s known as “volatility.”
While heightened volatility can be a sign of trouble, it’s all but inevitable in long-term investing—and it may actually be one of the keys to investing success.
Market volatility is the frequency and magnitude of price movements, up or down. The bigger and more frequent the price swings, the more volatile the market is said to be.
Market volatility is a normal part of investing and is to be expected in a portfolio. If markets went straight up, then investing would be easy and we’d all be rich.
Market volatility is measured by finding the standard deviation of price changes over a period. The statistical concept of a standard deviation allows you to see how much something differs from an average value.
We’ll show you how to calculate it below, but for now, simply keep in mind that “the higher the standard deviation, the more that portfolio is going to move around, up or down from the average,” says Brad Linebarger, CFP, president and founder of Seaside Wealth Management in Carlsbad, Calif.
Standard deviations are important because not only do they tell you how much a value may change, but they also provide a framework for the odds it will happen. Sixty-eight percent of the time, values will be within one standard deviation of the average, 95% of the time they’ll be within two and 99.7% of the time they’ll be within three.
That said, let us revisit standard deviations as they apply to market volatility. Traders calculate standard deviations of market values based on end-of-day trading values, changes to values within a trading session—intraday volatility—or projected future changes in values.
The VIX—also known as the “fear index”—is the most well-known measure of stock market volatility. It gauges investors’ expectations about the movement of stock prices over the next 30 days based on S&P 500 options trading. The VIX charts how much traders expect S&P 500 prices to change, up or down, in the next month.
Generally, the higher the VIX, the more expensive the options. This is for a couple of reasons: First, remember that a type of options, called puts, are agreements for traders to sell shares, in this case of the S&P 500, at a certain price at a certain time. These puts become more desirable (and expensive) as the likelihood increases that the S&P 500 will fall in value. If the S&P 500 falls below the sell price of their puts, they earn a profit.
The rising value of these puts, then, becomes a bellwether of expected market declines—and by extension volatility because in general the stock market experiences more drastic changes in value up or down when things are overall trending downward.
Historically, the normal levels of VIX are in the low 20s, meaning the S&P 500 will differ from its average growth rate by no more than 20% most of the time. The VIX, however, has been lower over the last 10 years.
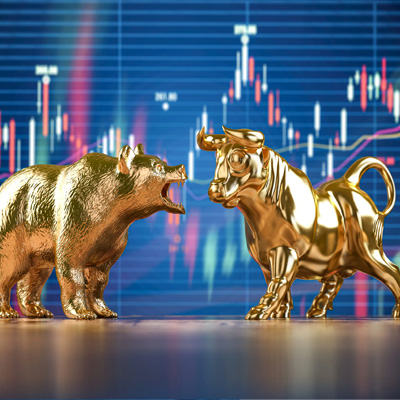
In general, bullish (upward-trending) markets tend to be associated with low volatility, and bearish (downward-trending) markets usually come with unpredictable price swings, which are typically downward.
There are countless ways you can react to the up-and-down activity of your portfolio. But one thing’s certain: Experts don’t recommend panic selling after a big market drop.
In the periods since 1970 when stocks fell 20% or more, they generated the largest gains in the first 12 months of recovery, according to analysts at the Schwab Center for Financial Research. So if you hopped out at the bottom and waited to get back in, your investments would have missed out on significant rebounds, and they might’ve never recovered the value they lost.
Investing is a long-haul game, and a well-balanced, diversified portfolio was actually built with periods like this in mind. If you need your funds in the near future, they shouldn’t be in the market, where volatility can affect your ability to get them out in a hurry. But for long-term goals, volatility is part of the ride to significant growth.
“Volatility is the price you pay when investing in assets that give you the best chance of reaching long-term goals,” says Gage Paul, CFP, a financial advisor in Hudson, Ohio. “It is expected and could be viewed as a cost in meeting these goals.”
It may help you mentally deal with market volatility to think about how much stock you can purchase while the market is in a bearish downward state.
“Particularly in stocks that have been strong over the past few years, periods of volatility actually give us a chance to purchase these stocks at discounted prices,” Garcia says.
During the bear market of 2020, for instance, you could have bought shares of an S&P 500 index fund for roughly a third of the price they were a month before after over a decade of consistent growth. By the end of the year, your investment would have been up about 65% from its low and 14% from the beginning of the year.
Market volatility isn’t a problem unless you need to liquidate an investment, since you could be forced to sell assets in a down market. That’s why having an emergency fund equal to three to six months of living expenses is especially important for investors.
“We set aside an appropriate emergency fund so clients do not have to worry about selling down investments to fund cash needs during periods of market volatility. “This creates peace of mind for clients.”
If you’re close to retirement, planners recommend an even bigger safety net, up to two years of non-market correlated assets. That includes bonds, cash, cash values in life insurance, home equity lines of credit and home equity conversion mortgages.
“When the market is down, pull money from those and wait for the market to rebound before withdrawing from your portfolio,” says Benjamin Offit, CFP, an advisor in Towson, Md.
Because market volatility can cause sharp changes in investment values, it’s possible your asset allocation may drift from your desired divisions after periods of intense changes in either direction.
During these times, you should rebalance your portfolio to bring it back in line with your investing goals and match the level of risk you want. When you rebalance, sell some of the asset class that’s shifted to a larger part of your portfolio than you’d like, and use the proceeds to buy more of the asset class that’s gotten too small. It’s a good idea to rebalance when your allocation drifts 5% or more from your original target mix.
You also may want to rebalance if you see a deviation of greater than 20% in an asset class. For instance, if you’re aiming for emerging market stocks to be 10% of your portfolio, and after a big market swing, you discovered that emerging markets were more like 8% or 12% of your portfolio, you may want to tweak your holdings.
It’s not unusual to be concerned by periods of market volatility. It can be scary to see large—or even small—losses on paper. But in the end, you must remember that market volatility is a typical part of investing, and the companies you invest in will respond to a crisis.
“Companies are very resilient; they do an amazing job of working through whatever situation may be arising. “While it’s tempting to give in to that fear, I would encourage people to stay calm. With history as our guide, those who are patient and disciplined have done very well.” Even considering periods like the Great Recession and times of large volatility, the U.S. stock market has provided average annual returns of about 10% each year long term.

Earnings reports increase a company’s chances of experiencing a rise in price or value of the company’s stock.
February 27, 2024

Derivatives are financial instruments that derive their value from the value of another asset.
February 27, 2024
Investment firms, fund managers and independent traders all rely on the right..
January 31, 2024
You must have often heard investors talking about a Bull..
January 31, 2024

With the stock market getting tougher to navigate every day
March 30, 2023
The RSI (Relative Strength Index) is a momentum indicator that is used in technical analysis.
April 11, 2023

As a new options trader, it is not uncommon to feel overwhelmed. One of the benefits of trading
April 11, 2023
Earnings season is a period during which a lot of public companies release their earnings reports, which contain information about the company and its finances
April 20, 2023
Earnings season is a period during which a lot of public companies release their earnings reports
May 9, 2023
The stock market never stays still. Market indexes see gains and losses every day
May 10, 2023