
Call Our Support
+91-9810811460
S 139, Arjun Marg Mall,
DLF Phase 1, Gurgaon 122002
Write Us
contactwelpro@gmail.com
Typical traders have come across the word, ‘Fibonacci’ in the trading universe more times than they care to mention. You will even find stock market analysts on television suggesting that stocks are trading close to Fibonacci levels. Stock charts that traders analyse and examine to determine the feasibility of trading in the stock often contain Fibonacci ratio applications. What does all this mean? It’s a good idea to find out before you embark on trading.
Fibonacci numbers, or retracements as they are referred to by traders, are popular key aspects of technical analysis in trading. Based on the crucial numbers that were identified by a mathematician called Leonardo Pisano, with a nickname, ‘Fibonacci’, in the 13th century, Fibonacci's number sequence is famous with traders that rely on technical analysis. The actual numbers are not as relevant as the relations of the mathematical nature they express in terms of ratios.
Fibonacci series is a series of numbers beginning from 0 and arranged in such a manner that any particular number of the series is simply the summation of previous two numbers which is shown below-
0, 1, 1, 2, 3, 5, 8, 13, 21, 34, 55, 89, 144, 233, 377 and so on.
Lets understand the above logic with an example-
377 = 233 + 144
233 = 144 + 89
144 = 89 + 55
89 = 55 +34
55 = 34 + 21
34 = 21 + 13
And it goes on
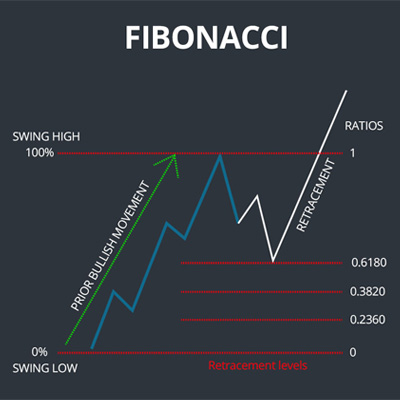
In trading, whenever stocks move up or down, somewhat sharply, they tend to retrace their steps before any more moves are made. These are called retracements, and they can be predicted according to mathematical ratios. The Fibonacci sequence of numbers in which one number is found as a result of adding the last two before it. Hence, the series begins with 0, 1, and continues with 2, 3, 5, 8, 13, 21 and so on and so forth. If you pick out a number in the sequence and divide that number by the immediate previous one, you always get the approximate ratio of 1.618.
When you open a trading account, you may not think of any Fibonacci numbers at first. However, if you know how these can help your trading strategy to gauge stock price activity, you may be interested in learning more. As discussed earlier, the ratio of a number when divided by its neighbour equals 1.618. This is known as the golden/perfect ratio. This represents a perfect spiral’s proportion in nature, like that of a pineapple, for instance. Such a ratio can be correlated to the actions of stock prices related retracements that happen when stocks shift upwards and downwards.
Explaining the Fibonacci rule in terms of an example, in case you buy a stock that is at a price of Rs. 100, you could multiply it by the ratio and get a level at which you know could be an effective position for a stop-loss. Also, Fibonacci ratios, for instance 61.8%, 38.2% and 23.6% can do a lot to aid traders to determine any possible degree of retracement of stocks when they shift up and down in prices. Ratios that are multiplied by the prices of stocks can give traders some clue as to effective levels of stop loss points, levels to target and points of entry. Ratios also help to determine the potential extent that a stock can retrace itself. Hence, Fibonacci numbers can help traders to use specific levels to position themselves while trading. If you want to enter trading and be a success, first you have to open a demat account with a proficient broker. Then, you can learn more about different techniques of analysis and tactics to help you in your trading endeavours.

Earnings reports increase a company’s chances of experiencing a rise in price or value of the company’s stock.
February 27, 2024

Derivatives are financial instruments that derive their value from the value of another asset.
February 27, 2024
Investment firms, fund managers and independent traders all rely on the right..
January 31, 2024

You must have often heard investors talking about a Bull..
January 31, 2024

With the stock market getting tougher to navigate every day
March 30, 2023

The RSI (Relative Strength Index) is a momentum indicator that is used in technical analysis.
April 11, 2023

As a new options trader, it is not uncommon to feel overwhelmed. One of the benefits of trading
April 11, 2023
Earnings season is a period during which a lot of public companies release their earnings reports, which contain information about the company and its finances
April 20, 2023
Earnings season is a period during which a lot of public companies release their earnings reports
May 9, 2023

The stock market never stays still. Market indexes see gains and losses every day
May 10, 2023